In today’s digital age, having a good website browsing user experience is not just a convenience but a critical necessity.
Google with its Web Vitals metrics has made it clear that a good site experience is a key factor in its search algorithms. This makes optimization not just desirable, but essential for any website owner looking to improve their online visibility.
This article breaks down the challenges WordPress sites face in terms of performance and offers a step-by-step guide towards effective optimization.
Speed vs Performance
Web Performance is wide term that Google, in its performance research web.dev, elaborates:
Performance is about retaining users. Performance is about improving conversions. Performance is about the user experience.
And speed is one of the defining factors.
Google Why does speed matter?
We can consider speed a common factor, which could be defined as one of the factors that impact almost all performance areas. We can measure speed during the Page Load but also pursue speed in terms of responsiveness or visual stability.
In this post we’ll focus on the speed as a Performance factor during the Page build and Network stages.
Having a good speed in its first stages is basic in order to improve the basis of all the other metrics used to measure a good user experience.
Our post goal: focus on the effectiveness by tackling the main WordPress speed factors.
The web page load layers
Who is Who in terms of speed taking a look at the different page load layers?
Before playing with WordPress speed dials, we need to understand the basics about the page load layers. When we measure all the stages involved in building, loading, and processing all the web page resources, we refer to its browser page load time.
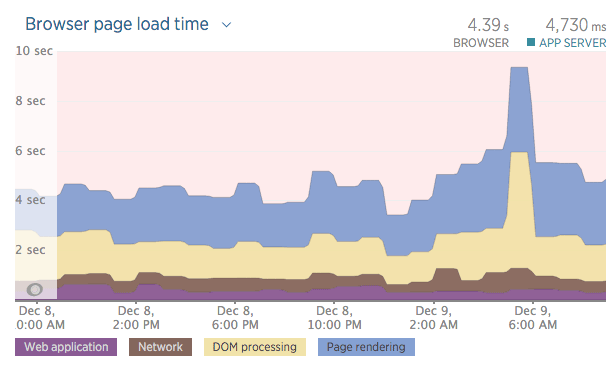
In this chart from Newrelic, it’s easy to identify the four phase segments of a browser page load time:
We’ll talk about them, so it’s important to understand, or at least to have a basic idea (take a quick look at the words in bold).
- Web application: The time spent by the server building the page we are requesting.
- Network: The Network layer includes time spent in redirects as well as in requesting and receiving the requested web page.
- DOM processing: The time it takes to parse the HTML into a DOM and retrieve and execute synchronous scripts.
- Page rendering: This phase measures browser-side processing of the page content, and often includes time for scripts and static assets to load.
All phases are important. You can buy the most expensive WordPress hosting service with an excellent Web application and Network time and ruin the Browser Page Load Time by having a slow Page rendering.
This is what the above chart shows: an average of 1 second in Web application and Network, but more than 4 seconds spent in Browser Time!
Pay attention to all speed phases.
If you want a fast WordPress site, you have to pay attention to all speed phases.
WordPress is such a powerful piece of software that it can play against your WordPress Page Load speed.
Core Web Vitals
Page load time was one of the main performance metrics used until May 2020, when Google’s performance team introduced the Core Web Vitals. These are a set of user-centric metrics aimed at assessing a page’s ‘health’ in terms of delivering a smooth and seamless user experience.
While browser Page Load time was once a popular metric, it doesn’t fully reflect the various aspects of user experience when navigating a website.
Modern metrics like Core Web Vitals, including Largest Contentful Paint (LCP), Interaction to Next Paint (INP), and Cumulative Layout Shift (CLS), provide a more realistic user experience performance indicator.
The relevance of Web application and Network phases
The fact is that improving your site’s Core Web Vitals requires achieving good speed in both the initial Web application and Network stages.
Why? Because The Largest Contentful Paint (LCP) metric measures the time taken to display the largest image or text block visible in the viewport, including the time spent during Web application and Network transport.
As a result, the primary approach to enhancing your WordPress Performance metrics involves minimizing the time expent during these preliminary stages.
Optimizing WordPress site performance
From now on we will cover Web application and Network speeds. But where should we direct the focus of our metric tools?
It’s important to note that in WordPress, we have two speeds to consider:
- The speed our users perceive when browsing the site “the frontend speed“, and
- The speed we as administrators feel when managing our WordPress from the admin panel “the backend speed“.
Each one has a different treatment, thus, we will use the terms “user speed” and “admin speed” to refer to each one.
Both speed phases will help us to identify bottlenecks and tune this three players involved:
- The WordPress theme and plugin stack: main responsible for the workload our server needs to process during the building phase.
- Our WordPress server: responsible for building web pages (Web Application speed).
- Provider of network infrastructure: in charge of delivering requests and contents (Network speed).
TTFB: the key to Web Performance
We are lucky, TTFB – Time to first byte is a foundational metric for measuring our Web application and network speeds.
TTFB gives us an idea of time spent contacting our server (latency) and building our page (backend processing).
Wikipedia defines Time To First Byte as “the duration from the virtual user making an HTTP request to the first byte of the page being received by the browser“.
This Time-To-First-Byte metric, allows us to measure and enhance the components of our WordPress site, while also profiling the performance of our hosting provider. By focusing on reducing this metric, we can iteratively improve both the efficiency of our site and the performance of our hosting service.
What is a good TTFB when measuring the WordPress user speed?
TTFB does have a strong impact when analyzing your WordPress front user speed with Google Page Speed, or Google Lighthouse:
| Time To First Byte in milliseconds | Google Page Speed impact. |
| 10 to 200 ms | Recommended by Google |
| 200 to 400 ms | Average |
| 400 to 600 ms | Slow |
| 800 to 1000 ms | Bad |
| 1000 ms or more | Google considers unacceptable. |
What is a good TTFB when measuring the WordPress admin speed?
When you work on the WordPress admin side, things are different. WordPress in the wp-admin needs more server resources. The content edit and WordPress administration tasks are done at a comfortable speed when our TTFB is less than 500ms.
How to measure the TTFB?
There is no need for extra tools, you can use your own browser. In our case we will use Chrome and its Developer Tools Network panel.
To open the “Developer Tools”, select:
- “Top Menu→View→Developer→Developer Tools” or
- “⌥+⌘+I” on Mac or
- “F12+Ctrl+Shift+I” on Windows.
Note: you can also open it from the top right “Three dot menu”:
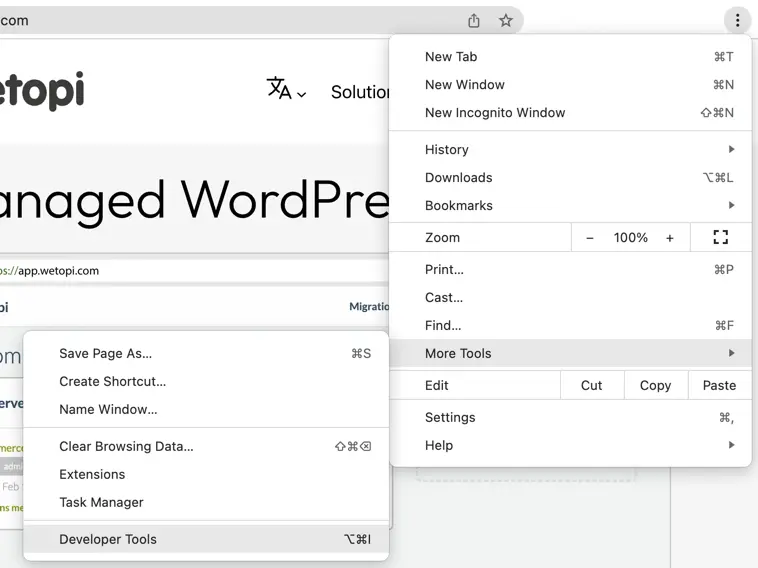
Then, from the Developer Tools window, select the Network tab:

On the left column, we have all the elements requested. Don’t get overwhelmed, we will only work with the first request, in our case, our main HTML page at wetopi.com:
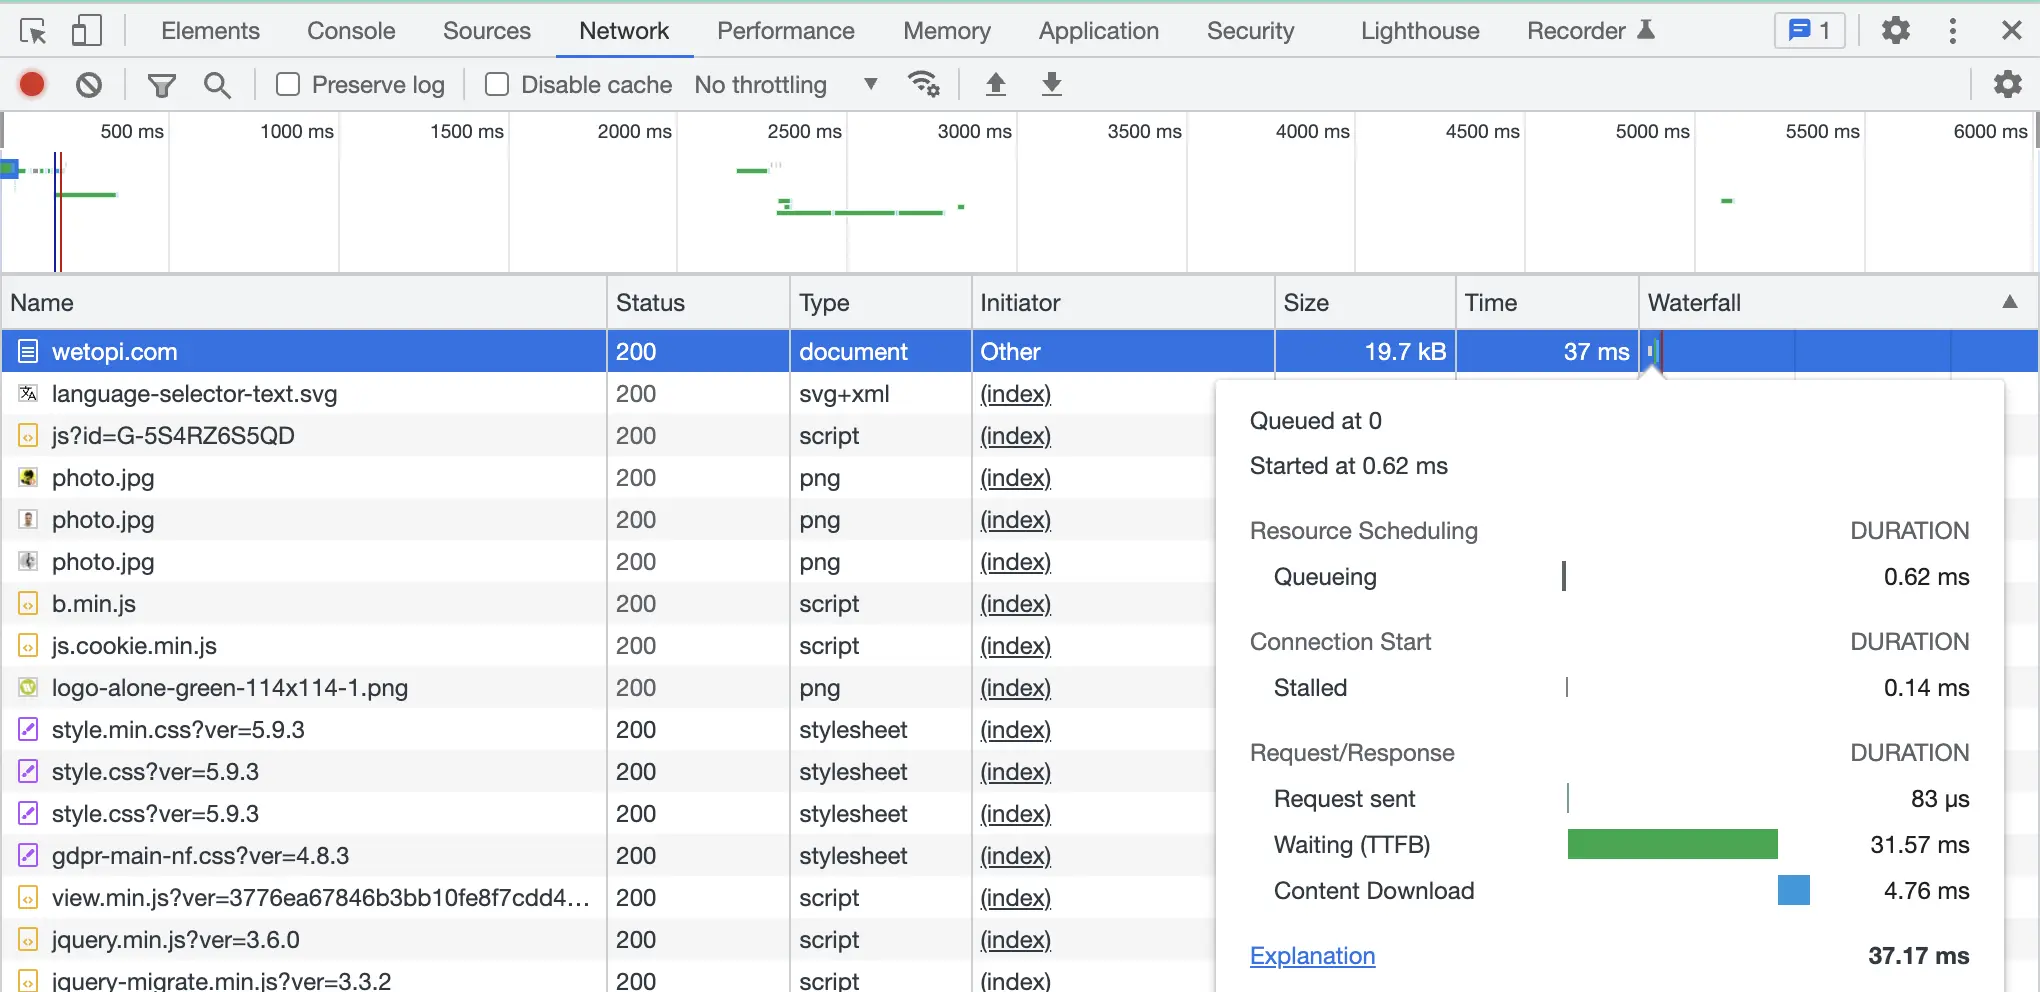
Above our TTFB is 31.57 ms. This is an excellent result. Read on the next section the checklist we followed to achieve this result.
Let’s see the “admin speed“. This next capture shows a much higher TTFB, 327.38 ms. It’s the time measured when, being in our WordPress admin panel, we press “Update”. Below, a capture taken while working on this post.
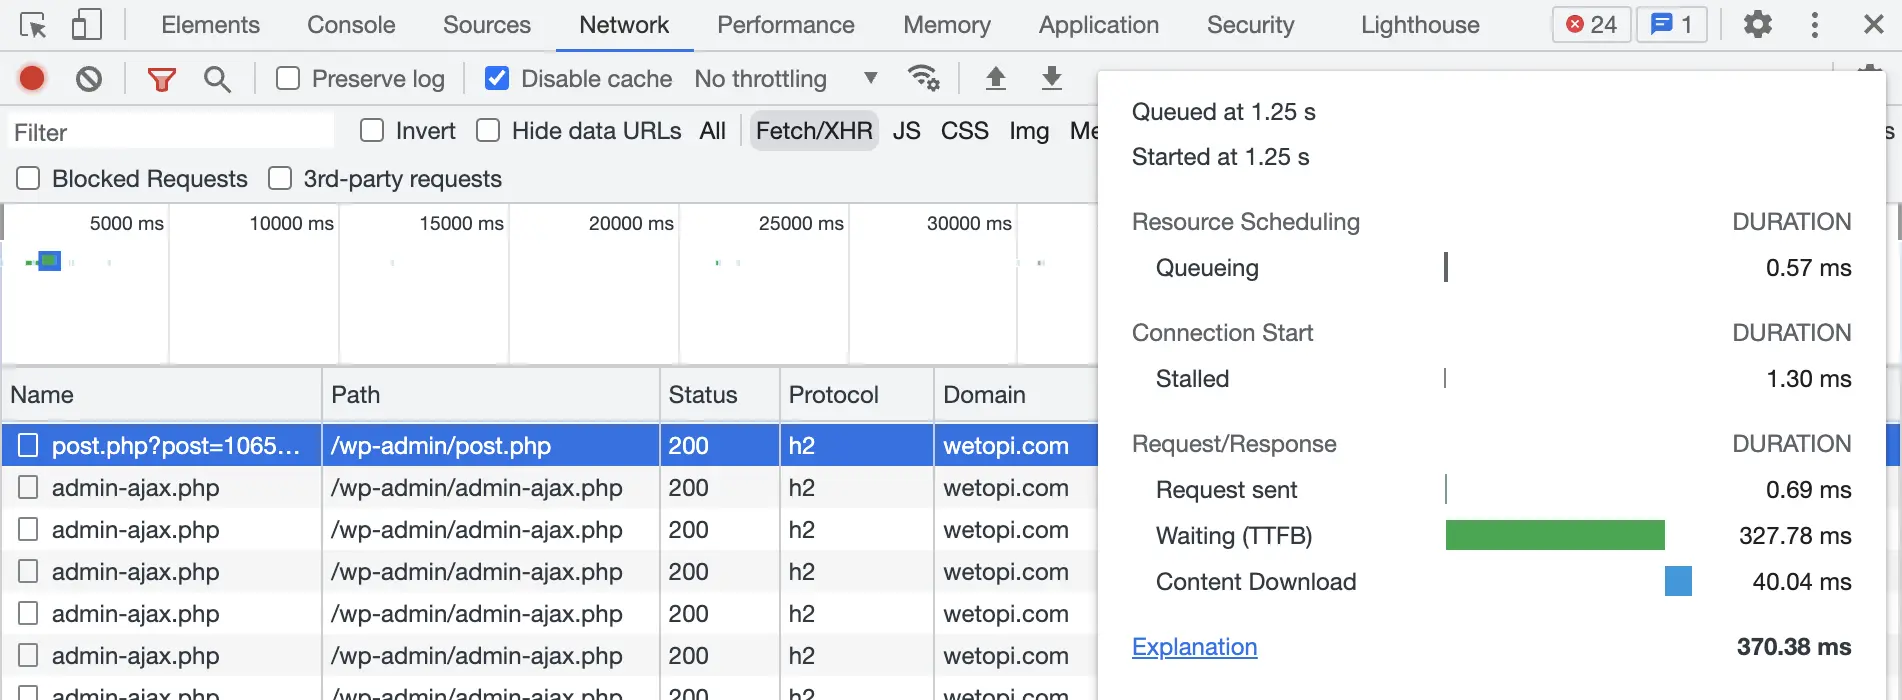
In the WordPress admin panel, we are not taking advantage of all the caching techniques offered by our plugins and hosting providers. We need Pure Server Performance and a lean WordPress.
WordPress Performance Optimization steps
This section covers the fundamental steps to improve your website’s TTFB, which serves as the basis or foundation for WordPress Performance Optimization, as mentioned in previous sections.
1 Check your hosting Internet connection latency
A component of our TTFB is the network latency. Latency is how long it takes data to travel between its source and destination, measured in milliseconds.
MUST HAVE: a network latency of no more than 100 ms (same continent), or 200 ms (remote continent).
Build your latency map
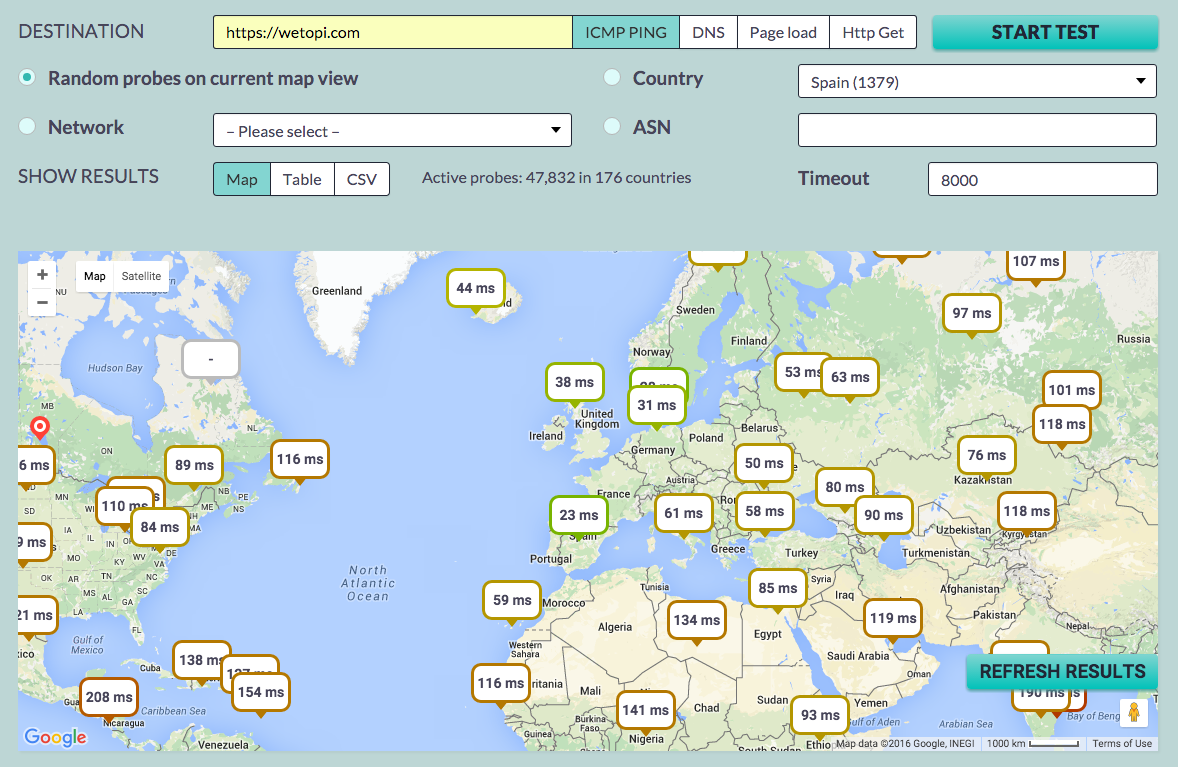
RECOMMENDED: Latency is directly related to the infrastructure of your provider. In case of a high latency:
- a) Tell this to your current provider and ask for a solution,
- b) Look for new providers. Locate the ones serving in the same continent your main audience lives and start tracing Latency Maps of their main site.
2 Run a lean WordPress site
The most common causes of big TTFB times are bloated plugins. Each plugin you install usually means less user speed and/or less admin speed.
A fast WordPress site:
- MUST HAVE: Just What You Need. Dan Norris, co-founder of WordPress website support service WP Curve (acquired by Godaddy), suggests that 20 plugins is a good number. At Wetopi, we are running with just 6 plugins!
- RECOMMENDED: Let your Web Server manage the page redirections, or use a redirection plugin that work by writing the configuration files for your Web Server. Web servers execute redirections much more efficiently than WordPress plugins.
- RECOMMENDED: Use with caution the Firewall WordPress Plugins. Filtering traffic is a resource-intensive task for WordPress. Instead, consider using an external firewall service designed to filter, inspect, and manage traffic efficiently.
- RECOMMENDED: One way to see which plugins are affecting your site’s performance is to use the WordPress plugin Query Monitor or WP-CLI with its profile module
wp profile <command> - MUST HAVE: Use a clone or a staging environment. Each plugin, template or demo content you test usually means more server process time. It’s good to know that when you uninstall a plugin, template, …, your WordPress not always ends up as clean as it was before!
Don’t think “cloning” your WordPress is a waste of time! Do it to test a faster version of your site safely.
It takes just seconds to experiment with a clone of your production site!
No more excuses.
3 Optimize your database tables
If you have been running your WordPress site for a long time, don’t forget to optimize and clean your database.
- RECOMMENDED: Optimize your database contents with WP-Optimize. This simple but effective plugin allows you to clean up your WordPress database and optimize it without phpMyAdmin.
- MUST HAVE: switch to InnoDB if your tables still run with the MyISAM engine. InnoDB offers better performance, reliability, and scalability.
4 Get a Fast Server Hardware
Hardware and software are big players in TTFB. A Fast Server Hardware should follow these recommendations:
- MUST HAVE: a hosting with reserved resources: With Wetopi we are using containers, the last technology, this makes a huge difference, and avoids the extra cost of a dedicated server sysadmin (yes, the administration is the real cost of a dedicated server).
- MUST HAVE: a hosting with SSD (Solid State Disks), and the latest NVM Express (NVMe) interfaces.
- AVOID: a hosting with SSD and no RAID (no redundancy). SSD are more reliable, but also can fail. Don’t take risks.
- MUST HAVE: check your PHP engine has the OpCache Caching or equivalent up and running.
- RECOMMENDED: php8. Look for a hosting with sandboxing environments, or easy to clone so that you can test your site with the new engine (WordPress is php8 ready, but you must check the compatibility of your plugins).
In our case, we have passed all checks! This page is running on a WordPress in a standard containerized wetopi server, where hardware, web server and configs are all tuned exclusively for a fast WordPress site experience.
5 Get a Fast Server Software
MUST HAVE: An Nginx or Litespeed web server tuned to serve WordPress pages. Nginx properly configured combined with PHP-fpm can easily be 2 times faster compared to standard Apache+mod_php.
Improve the speed with HTTP/3
This is the HTTP network protocol used by the World Wide Web. This new HTTP/2 and HTTP/3 do not require any changes to how existing web applications work, and all web site applications can take advantage of new features for increased speed.
What is HTTP/3?
HTTP/3 is the next major revision of the hypertext transfer protocol (HTTP). It will improve speed, security, and reliability.
Test the HTTP/3 performance at Wetopi. Try it out today – we’ll migrate a copy of your site for FREE! – Zero commitments.
RECOMMENDED: a modern web server with HTTP/3
MUST HAVE: SSL handshaking is the major cost of the HTTPS connection process. You must jump to, at least HTTP/2 protocol with TLS 1.3, to compensate this handshaking delay with the new speed improvements.
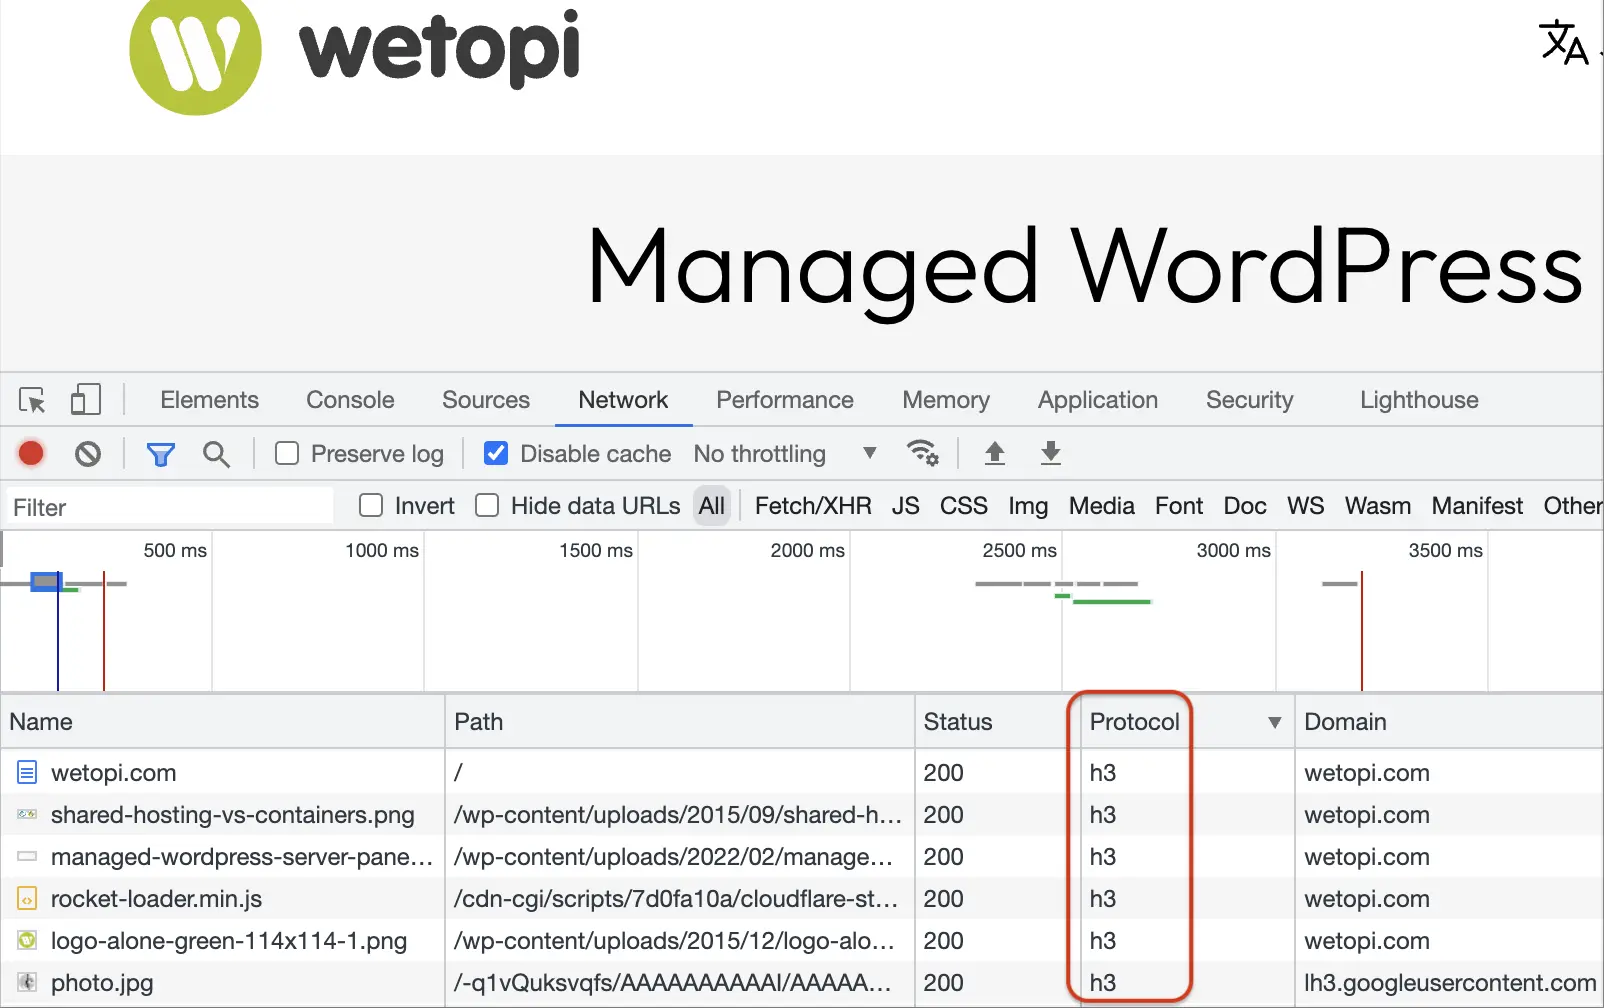
How to identify the HTTP protocol version?
There is no need for extra tools, you can use the Google Chrome Developer Tools.
The protocol is shown in the Network panel, above in this article (“Using the browser to measure the TTFB”). If you don’t see the Protocol column, right-click over the list titles row, and select the columns you want to display.
6 Cache
Once we have addressed the previous points 1 through 5, it’s time to implement a caching system. TTFB for users browsing your site, can be reduced with a cache system. This cache system will serve our posts and pages as static files, reducing the processing load on the server.
RECOMMENDED: Use a WordPress cache plugin: WP Super Cache (complexity: low, model: free), WP rocket (complexity: low, model: comercial plugin), W3 Total Cache (complexity: high, model :freemium).
Conclusion
If you are reading this, you are taking it seriously. Don’t get upset if we have forgotten some crucial aspect. Tuning for speed is a complex subject and we are focusing on the effective path. Let us know, and help us to build this path to a fast WordPress site.
Don’t you have an account on Wetopi?
Free full performance servers for your development and test.
No credit card required.
