

As an SEO consultant, I’ve spent a long time diagnosing websites that work technically but never quite take off. The pattern repeats often: general-purpose hosting with correct specs —NVMe, updated PHP, object caching—, mid-tier metrics, performance that worries no one. And a domain that, nonetheless, is leaving part of its SEO potential on the table without anyone noticing.
It’s not that they fail. It’s that they never reach what they could.
For a while, seomanager.es was in that category. Nothing urgent. Nothing broken. The migration to Wetopi in the final days of December 2025 wasn’t a response to a problem. It was an optimization decision.
What the data has documented since then is a different conversation.
What “acceptable” doesn’t account for
The difference between a server that responds in average times and one that responds in optimal times isn’t visible day to day.
It accumulates. It accumulates in how often the crawler comes back, in how quickly an update gets reindexed, in the quality of the signal Google receives every time it passes through the domain. And, of course, in the ability to serve all the AI agents that matter.
When that accumulation shifts, GSC data tells a different story.
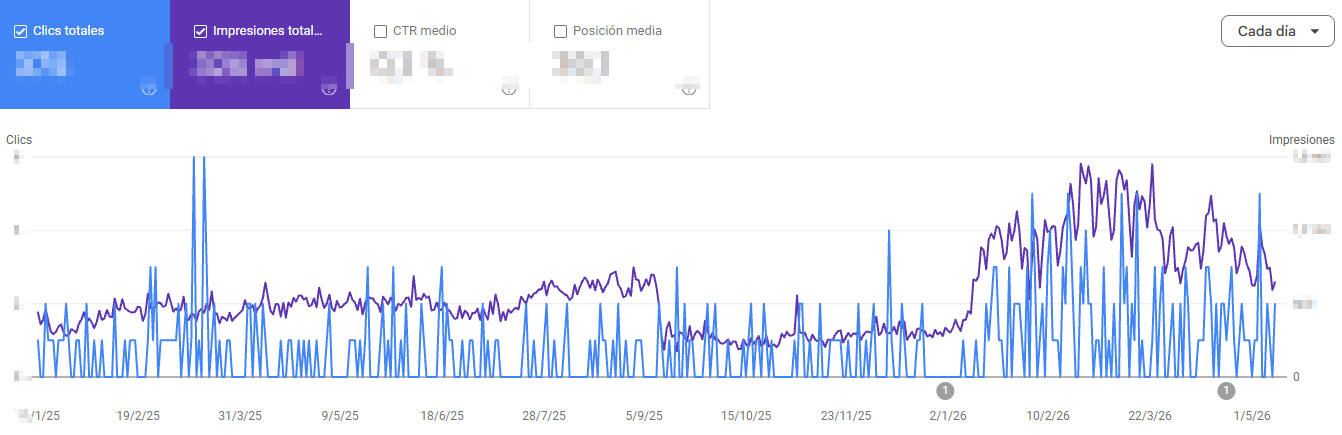
[SCREENSHOT 1: GSC seomanager.es — clicks and impressions, 16-month series. The click gap in December–January is visible: real B2B seasonality, which affects clicks but doesn’t interrupt the impression growth that began after the migration]
[SCREENSHOT 2: GSC seomanager.es — impressions and average position, 16-month series. The two annotations mark the migration to Wetopi and Google’s data attribution correction from April 2026]
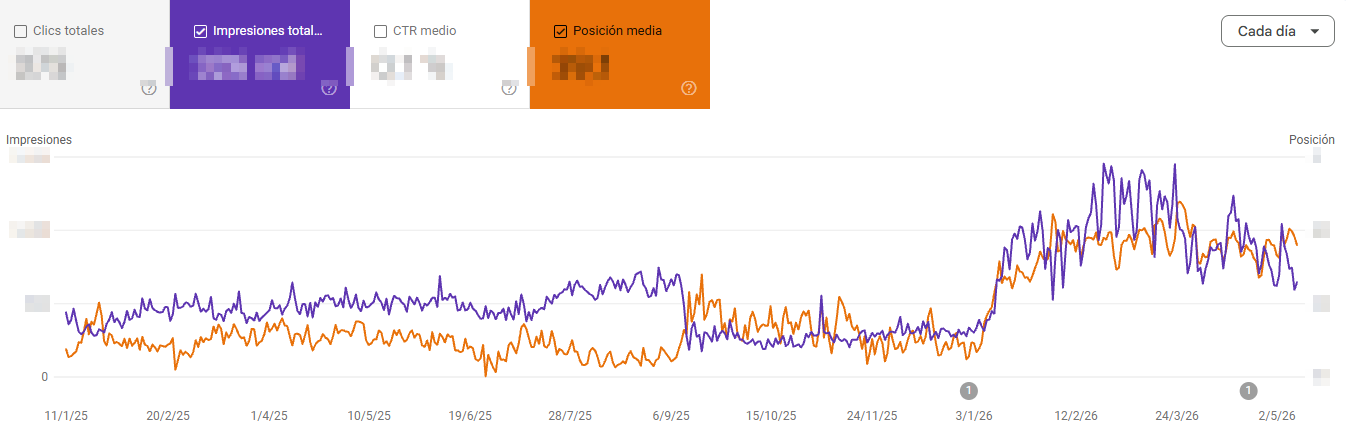
The inflection is visible right from the migration. What follows isn’t the result of publishing new content — throughout all of 2026 there is a single post on the domain, with no keyword optimization, on a topic with structurally low search volume. The impressions that grow come from pages that existed before the migration.
The pattern confirms it: the growth isn’t a smooth curve of accumulated traffic. It’s steps. Each step is a wave of reindexing — Google revisits the domain, redistributes keywords, improves rankings in bulk. The behavior of a crawler that comes back more often, not that of new content gradually gaining authority.
[SCREENSHOT 3: Ahrefs — organic keywords by SERP bracket, last 6 months. The 21-50 and 51+ bands are disabled: on September 11, 2025, Google restricted pagination to 100 results per page and keyword monitoring for positions 10+ was globally lost across all SEO tools, and the residual volume from those farther-out positions would distort the reading of the competitive positions that actually matter. The four Google updates marked on the timeline neither generate the growth steps nor interrupt them.]

The three active bands —positions 1-3, 4-10, and 11-20— grow simultaneously. That points to a systemic improvement of the domain, not of specific pages. If it were new content, you’d see one or two pages stand out. Here the whole set rises.
What the comparative data shows
The year-over-year comparison of the last three months against the same period in 2025 quantifies what the chart suggests.
[SCREENSHOT 4: GSC — Over the last three months, the project’s organic visibility has more than doubled (+108.7% in impressions), accompanied by 85.1% growth in clicks from Google. At the same time, the average position improved by 53.8%, reflecting a much more competitive presence in search results. CTR remained stable, indicating that the increase in potential traffic comes mainly from broader keyword coverage and ranking, not from changes in user behavior.]
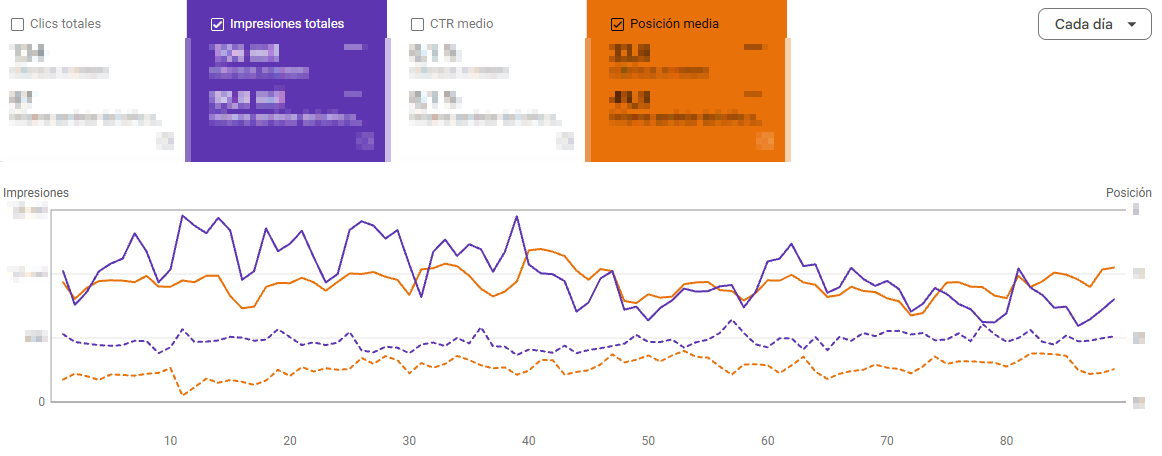
Organic visibility has more than doubled (+108%), while clicks have grown roughly 85%. Average position improves by close to 54%, a jump significant enough to turn a scenario of residual presence into one with real capacity to compete for visibility on Google. CTR remains stable between both periods, suggesting the improvement stems fundamentally from ranking and coverage expansion, not from changes in how users behave toward the displayed results.
This last data point rules out the improvement coming from optimized snippets, won featured snippets, or changes in how results are presented. What we have is double the impressions with the same click conversion rate. Pure new visibility, on content that already existed.
There’s also a statistical detail worth noting.
In GSC, a massive surge in impressions usually worsens the average position: new keywords entering the index tend to appear in lower positions, pulling the average up numerically.
Here the opposite happens: impressions double and the average position improves by 26.5 points. Keywords aren’t entering at low positions — they’re entering at competitive ones, or existing pages are jumping up suddenly.
Recrawling doesn’t just expand coverage; it improves how what was already there gets valued.
For anyone wanting to better understand the paradoxes of rising impressions, this article on CTR and average position covers it in more detail.
The cycle completes itself: better indexing → better ranking → more clicks. All three metrics rise together. If it were just a volume effect, clicks wouldn’t necessarily follow the same trend.
What doesn’t show up in the scores
There’s a dimension of managed hosting that doesn’t show up in performance analyses and that, for a consultant, is probably the most relevant one: what changes in the workflow.
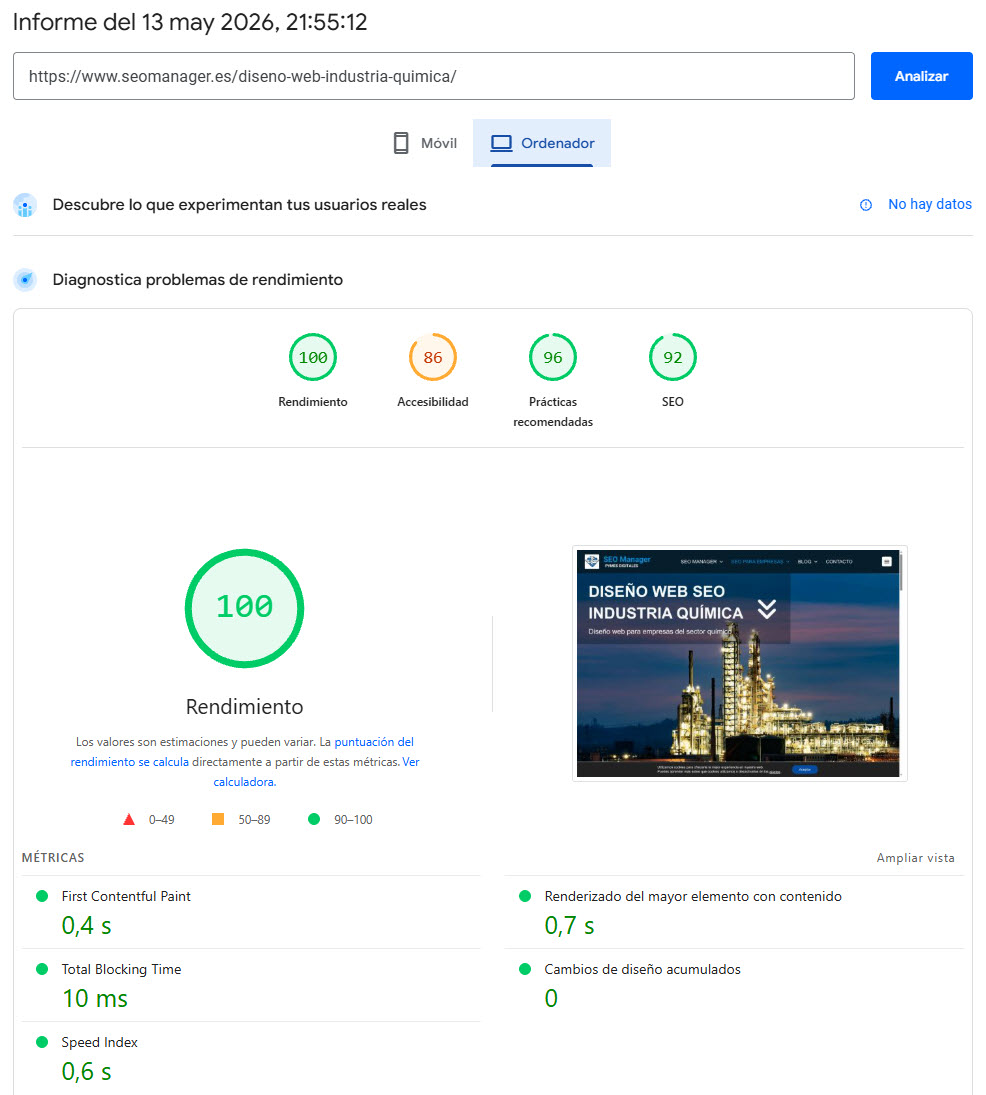
[SCREENSHOT 4: PageSpeed https://www.seomanager.es/diseno-web-industria-quimica/ — desktop]
[SCREENSHOT 5: PageSpeed https://www.seomanager.es/diseno-web-industria-quimica/ — mobile]
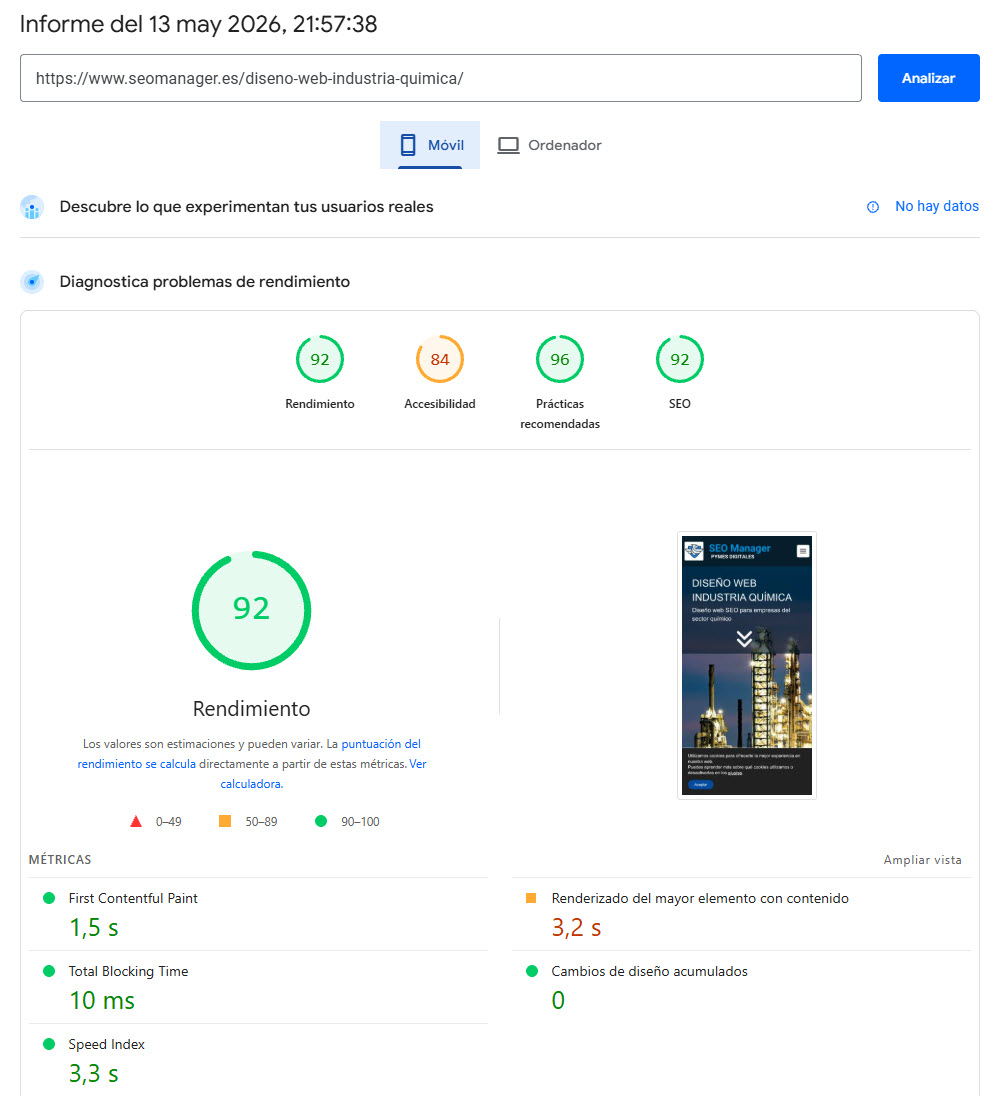
A perfect 100 performance score on desktop. FCP of 0.4 seconds, LCP of 0.7 seconds, TBT of 10 milliseconds, CLS of zero. On mobile, a performance score of 92. These aren’t lab metrics staged for a screenshot: they’re what PageSpeed Insights returns for a real service page, with an image, full text, and structured data.
But PageSpeed scores are the visible part. What changes underneath is the backend.
When the server responds fast, management time drops.
Operations that require patience in other environments get resolved without friction. And Wetopi’s parallel staging architecture turns operations that carry some risk into routine ones: testing plugin changes, custom development, editing templates, restructuring content without touching production.
The practical result is that you produce more in less time. The focus shifts from managing infrastructure to curating content. And content curation — keeping facts current, coherent, and well structured — is what determines the quality of a digital presence over the long run. This isn’t just talk; I’ve been doing it for years, and it gave me a clear qualitative leap.
In a context where AI systems retrieve information through iterative loops and where the freshness of content directly impacts the quality of the answers generated, infrastructure that lets you update quickly and without friction stops being an operational convenience and becomes a real competitive advantage.
“We’re doing fine”: The trap of good-enough hosting
This case is one of my own assets, but it perfectly illustrates the most common client scenario I mentioned at the start —a functional site, mid-tier metrics, technically correct hosting— with no sense of urgency because nothing is failing.
It’s the hardest scenario to manage as a consultant: convincing someone that there’s a cost in what isn’t happening.
The cost of good-enough hosting isn’t in the support invoices or the downtime. It’s in the crawl budget that goes unused, in the reindexing frequency that could be higher, in the staging cycles that don’t happen because they’re slow and risky, in the management time spent on operations that should be seamless.
Migrating to managed hosting isn’t fixing a problem. It’s moving up a level. And the difference between the two levels isn’t always visible until you’ve spent a few months at the second one and look back.
Ricard Menor is a freelance SEO consultant with more than 20 years of experience, specializing in semantic SEO and structured data architecture. Founder of SOLID SEO Management Services
Appendix: environment conditions and variables analyzed
This post describes a documented correlation between a hosting migration and a sustained improvement in Google Search Console metrics. What follows is a breakdown of the environment in which that change took place, aimed at identifying which variables stayed constant and which factors can be ruled out as alternative explanations.
Variables that didn’t change with the migration
CDN and proxy: seomanager.es ran on Cloudflare before the migration and continues to do so afterward. No change in the content delivery layer. PHP 8.4 in both environments. The previous hosting also had NVMe and Memcached. It wasn’t a degraded infrastructure: it was technically competent. The migration didn’t fix a broken environment — it elevated an already functional one.
Published content: a single new post throughout all of 2026, with no keyword optimization, on a topic with structurally low search volume. There’s no basis for attributing the impression growth to new content production.
Concurrent events identified
September 11, 2025: Google closes off the domain’s ?p=100 URL. A cause identified and isolated from the impression drop visible in that period, unrelated to hosting.
December 27–31, 2025: migration to Wetopi. The GSC annotation shows as January 1, 2026, due to proximity.
Late March 2026: a double Google algorithm update — a spam update and a core update at the same time. Visible as noise on the chart but without interrupting the upward trend.
Second GSC annotation (April 2026): Google’s data attribution correction, documented with the standard Search Console notice.
Variables ruled out
B2B seasonality in January: ruled out by evidence from the chart itself. January 2025 is visible in the time series and shows flat behavior. If seasonality existed, it would show up in both years.
New content effect: ruled out. The pages driving the increase in impressions are, in their entirety, content published before the migration.
CDN improvement: ruled out. Cloudflare present in both periods with no change.
Google updates: the four updates marked on the Ahrefs chart neither line up with the growth steps nor interrupt them. The growth predates the updates and continues through them.
Note on the Ahrefs chart
The chart shows the 1-3, 4-10, and 11-20 ranges. The 21-50 and 51+ bands are disabled: in September 2025, global monitoring of the domain was lost across all SEO tools, and the residual volume from those positions would distort the reading of the competitive positions that actually matter.
What’s different
The only differentiating factor between both periods is the backend: Wetopi’s managed WordPress infrastructure versus the previous general-purpose shared hosting. The correlation between that change and the sustained improvement in impressions and average position is documentable. Direct causality can’t be established with a single-case methodology, but the alternative explanations have been analyzed and ruled out one by one with evidence from the environment itself.